INTRODUCTION
Machine Down Time Monitoring
A Machine Downtime Reporting System is a tool or module within industrial monitoring and maintenance systems that tracks, records, analyzes, and reports periods when machinery is not operational—either due to breakdowns, maintenance, or other issues
🎯 Purpose:
To reduce production losses and improve operational efficiency by:
-
Identifying causes of downtime
-
Monitoring frequency and duration of downtime events
-
Supporting preventive maintenance planning
-
Improving machine utilization
🛠️ Key Features of a Machine Downtime Reporting System:
-
Automatic and Manual Logging:
-
Sensors/PLC detect when a machine stops
-
Operators can manually enter downtime reasons (e.g., maintenance, tool change, material shortage)
-
-
Downtime Categorization:
-
Scheduled vs. unscheduled
-
By cause: mechanical failure, electrical issue, operator error, etc.
-
-
Real-Time Alerts:
-
Notify maintenance teams or supervisors when machines stop unexpectedly
-
-
Reports and Dashboards:
-
Daily/weekly/monthly downtime reports
-
Top 10 machines by downtime
-
Pareto analysis of downtime causes
-
-
Integration with Other Systems:
-
Works with MES (Manufacturing Execution System), SCADA, ERP, or CMMS (Maintenance systems)
-
System Architecture
🎯 1. Data Acquisition Layer
-
Edge or PLC Devices / Sensors: Collect machine telemetry (e.g. status, run/stop signals).
-
Connectivity Middleware: For on-prem machines, solutions like AWS IoT Greengrass or MQTT brokers capture and securely forward data.
🛠️ 2. Ingestion & Real-time Processing
-
Streaming Pipeline: Use services such as Amazon Kinesis Data Streams/Firehose, or open-source counterparts (Kafka) to ingest live telemetry.
-
Filtering & Aggregation: Serverless functions (e.g. AWS Lambda) detect downtime events, calculate durations, and aggregate metrics.

🔍 3. Storage, Enrichment & Metadata
-
Real-time DB: Systems like DynamoDB store current machine status, tagging/grouping configurations for fast dashboard updates.
-
Historical Archive: Telemetry gets persisted to data stores like S3 for long-term insights. ◆
-
Catalog + BI Prep: AWS Glue catalogs S3 data, with query/reporting via Athena and visualization in Quick Sight.
📊 4. Visualization & Reporting
-
Real‑time Dashboard: Web app (hosted on S3 + CloudFront with AWS AppSync or equivalent). Displays heatmaps, status tiles, downtime trends. (shown in image 1).
-
Historical Reports: BI dashboards spotlight trends (e.g. pie charts of downtime reasons, time-series charts; see image 2).
-
Operator Input UI: Tablets or kiosks at machines prompt operators to classify stops (planned vs unplanned, reason, operator).
⚠️ 5. Alerts & Decision Support
-
Anomaly / Predictive ML: ML models or rule-based systems flag abnormal downtime or forecast failures.
-
Event Correlation: Tools like Prometheus/Alert manager/Grafana can correlate downtime with other system metrics.
-
Notifications: Alerts are routed via email, SMS, or Slack when thresholds (SLA breaches, repeated faults) occur.
👉 6. Integration & Feedback
-
Plant Integration: Tie outputs into MES/ERP systems to feed maintenance schedules, production planning.
-
Continuous Improvement: Historical root-cause analysis and KPI monitoring enable process refinement
Overview Dashboard
*Utilization Rate:
Utilization Rate%: We are calculating the utilization of machine in percentage. Formula = (Operational Run Time/Total Run Time)/100
*Average Cycle Rate
Avg Cycle Time: It is the Average Cycle Time of the Molding Machine Cycle. Formula: Operational Time / Cycle Counts
*Operational Time
Operational Time: If the machine feeding is not done within 2 minutes and machine hydraulic motor is on then the system stops the counting of operational time
*Total Time
Total Time: Total runtime of machine is calculated by the run status of the hydraulic motor.
*Cycle Count
Cycle Counts: Counting of the cycles is being done by the status of the machine door close feedback.
*Machine Status
Machine Status: Realtime Machine Status (If hydraulic Motor is on then it shows ON)
*Line Chart
Line Chart: Red line shows the Machine run time per hour and green line shows the operational time per hour
*Colum Chart
Cycle Counts Per Hour
*Navigation Menu
*Real Time Closed And Heating Status
*Real Time Machine Status

Reports

1. Navigation Menu
2. Select Timespan For Report
3. Select Interval
4. Click Download Report To Get Report
Daily Report
A daily machine downtime report is a structured summary—typically prepared at the end of each shift or day—designed to capture downtime events accurately, analyze issues, and drive continuous improvement. Here's how to build one effectively:

1. Objectives of a Daily Report
-
Log every downtime event (planned and unplanned).
-
Record key details: when, which machine, for how long, and why.
-
Assign responsibility and capture verification.
-
Provide immediate insights and prompt corrective actions.
📋 2. Essential Sections & Fields
A typical Daily Downtime Report Form includes:
-
Report Metadata: Date, Shift, Prepared by, Location.
-
Event Entries (for each downtime):
-
Machine ID
-
Downtime Start & End
-
Duration (auto-calculated or manually entered)
-
Category (e.g., mechanical issue, setup change, material shortage, other)
-
Description/Reason (free-text, dropdown, or checklist)
-
Planned vs. Unplanned (important for OEE and reliability analysis)
-
-
Verification: Verified by (person), signature or approval stamp.
-
Operator/Maintenance Notes: Optional comments or steps taken.
Hourly performance report

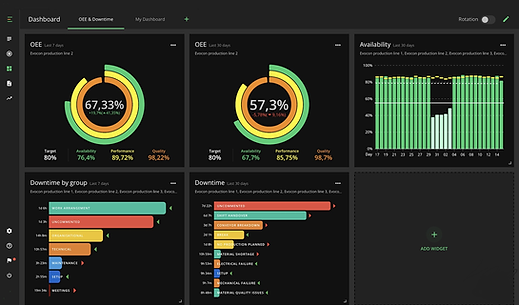
Downtime Reporting Supervisory Dashboard
A Downtime Reporting Supervisory Dashboard is a visual platform designed for supervisors and plant managers to monitor, analyze, and respond to equipment downtime in real-time and over historical periods. Here's a comprehensive breakdown:
Purpose & Benefits
-
Real-time detection: Shows which machines are running, idle, or in downtime right now.
-
Root cause insight: Displays Pareto charts and breakdowns by reason to highlight the key issues quickly
-
Performance comparison: Provides side‑by‑side views of shifts, machines, or lines to benchmark performance and identify weak spots


Downtime Reporting Display Module
A Downtime Reporting Display Module is a dedicated interface designed to clearly and visually present machine downtime data—making it easy for supervisors, operators, and managers to monitor, understand, and act on equipment stoppages.

🧩 What It Does
-
Show key downtime KPIs—including OEE, availability, MTBF, MTTR, and downtime duration—typically via gauges or summary tiles
-
Visualize downtime by reason—through Pareto charts or pie/bar graphs, showing which causes (e.g., breakdowns, material shortages, changeovers) dominate.
-
Offer timeline views—like Total Production Timeline™, shift-level charts or interactive Gantt-style visuals to spot patterns and correlations with shifts or events.
-
List detailed events—tables listing each downtime incident with start time, duration, machine, category, and notes
🛠️ How It Integrates
-
Automated data capture from PLCs, OPC UA, MT Connect, and shop-floor systems
-
Manual operator input supplements reason coding and root-cause details when required
-
Alerts and thresholds notify teams in real time when downtime exceeds configured limits or shifts
